
Guess what?

Most of the year, the course-advising platform I help build is quiet. A handful of logins, someone checking a schedule, the occasional admin task. If you only ever watched a normal Tuesday, you'd think it was a sleepy little site nobody uses.
Then Advising day arrives — the afternoon every student picks their sections for the coming term — and for a few hours it becomes one of the busiest things I've ever put on the internet. It happens roughly once every four months, on the trimester clock, so the system spends most of the year asleep and then gets mobbed three times a year on a schedule everyone can see coming.
This past summer term, at the single busiest minute, it took in 194,619 requests in sixty seconds — about 3,244 requests every second. Not spread politely across the afternoon. Concentrated into the first breath after the gates opened, when thousands of students tapped "select" at the same instant because a seat in the section they wanted was on the line.
Think train tickets on a holiday. Concert tickets the second they drop. That, but for the classes that shape someone's whole semester.
Two waves in one afternoon
It didn't come as one surge. It came as two.
The first wave hit at 10 AM, when priority students and ten smaller departments opened. Sharp spike, a scramble, a long tail as it settled. Then a couple of deceptively calm hours in the middle. At 1 PM the big departments — CSE and Data Science — opened together, and the floor dropped out. That second wave was the tallest spike of the day.
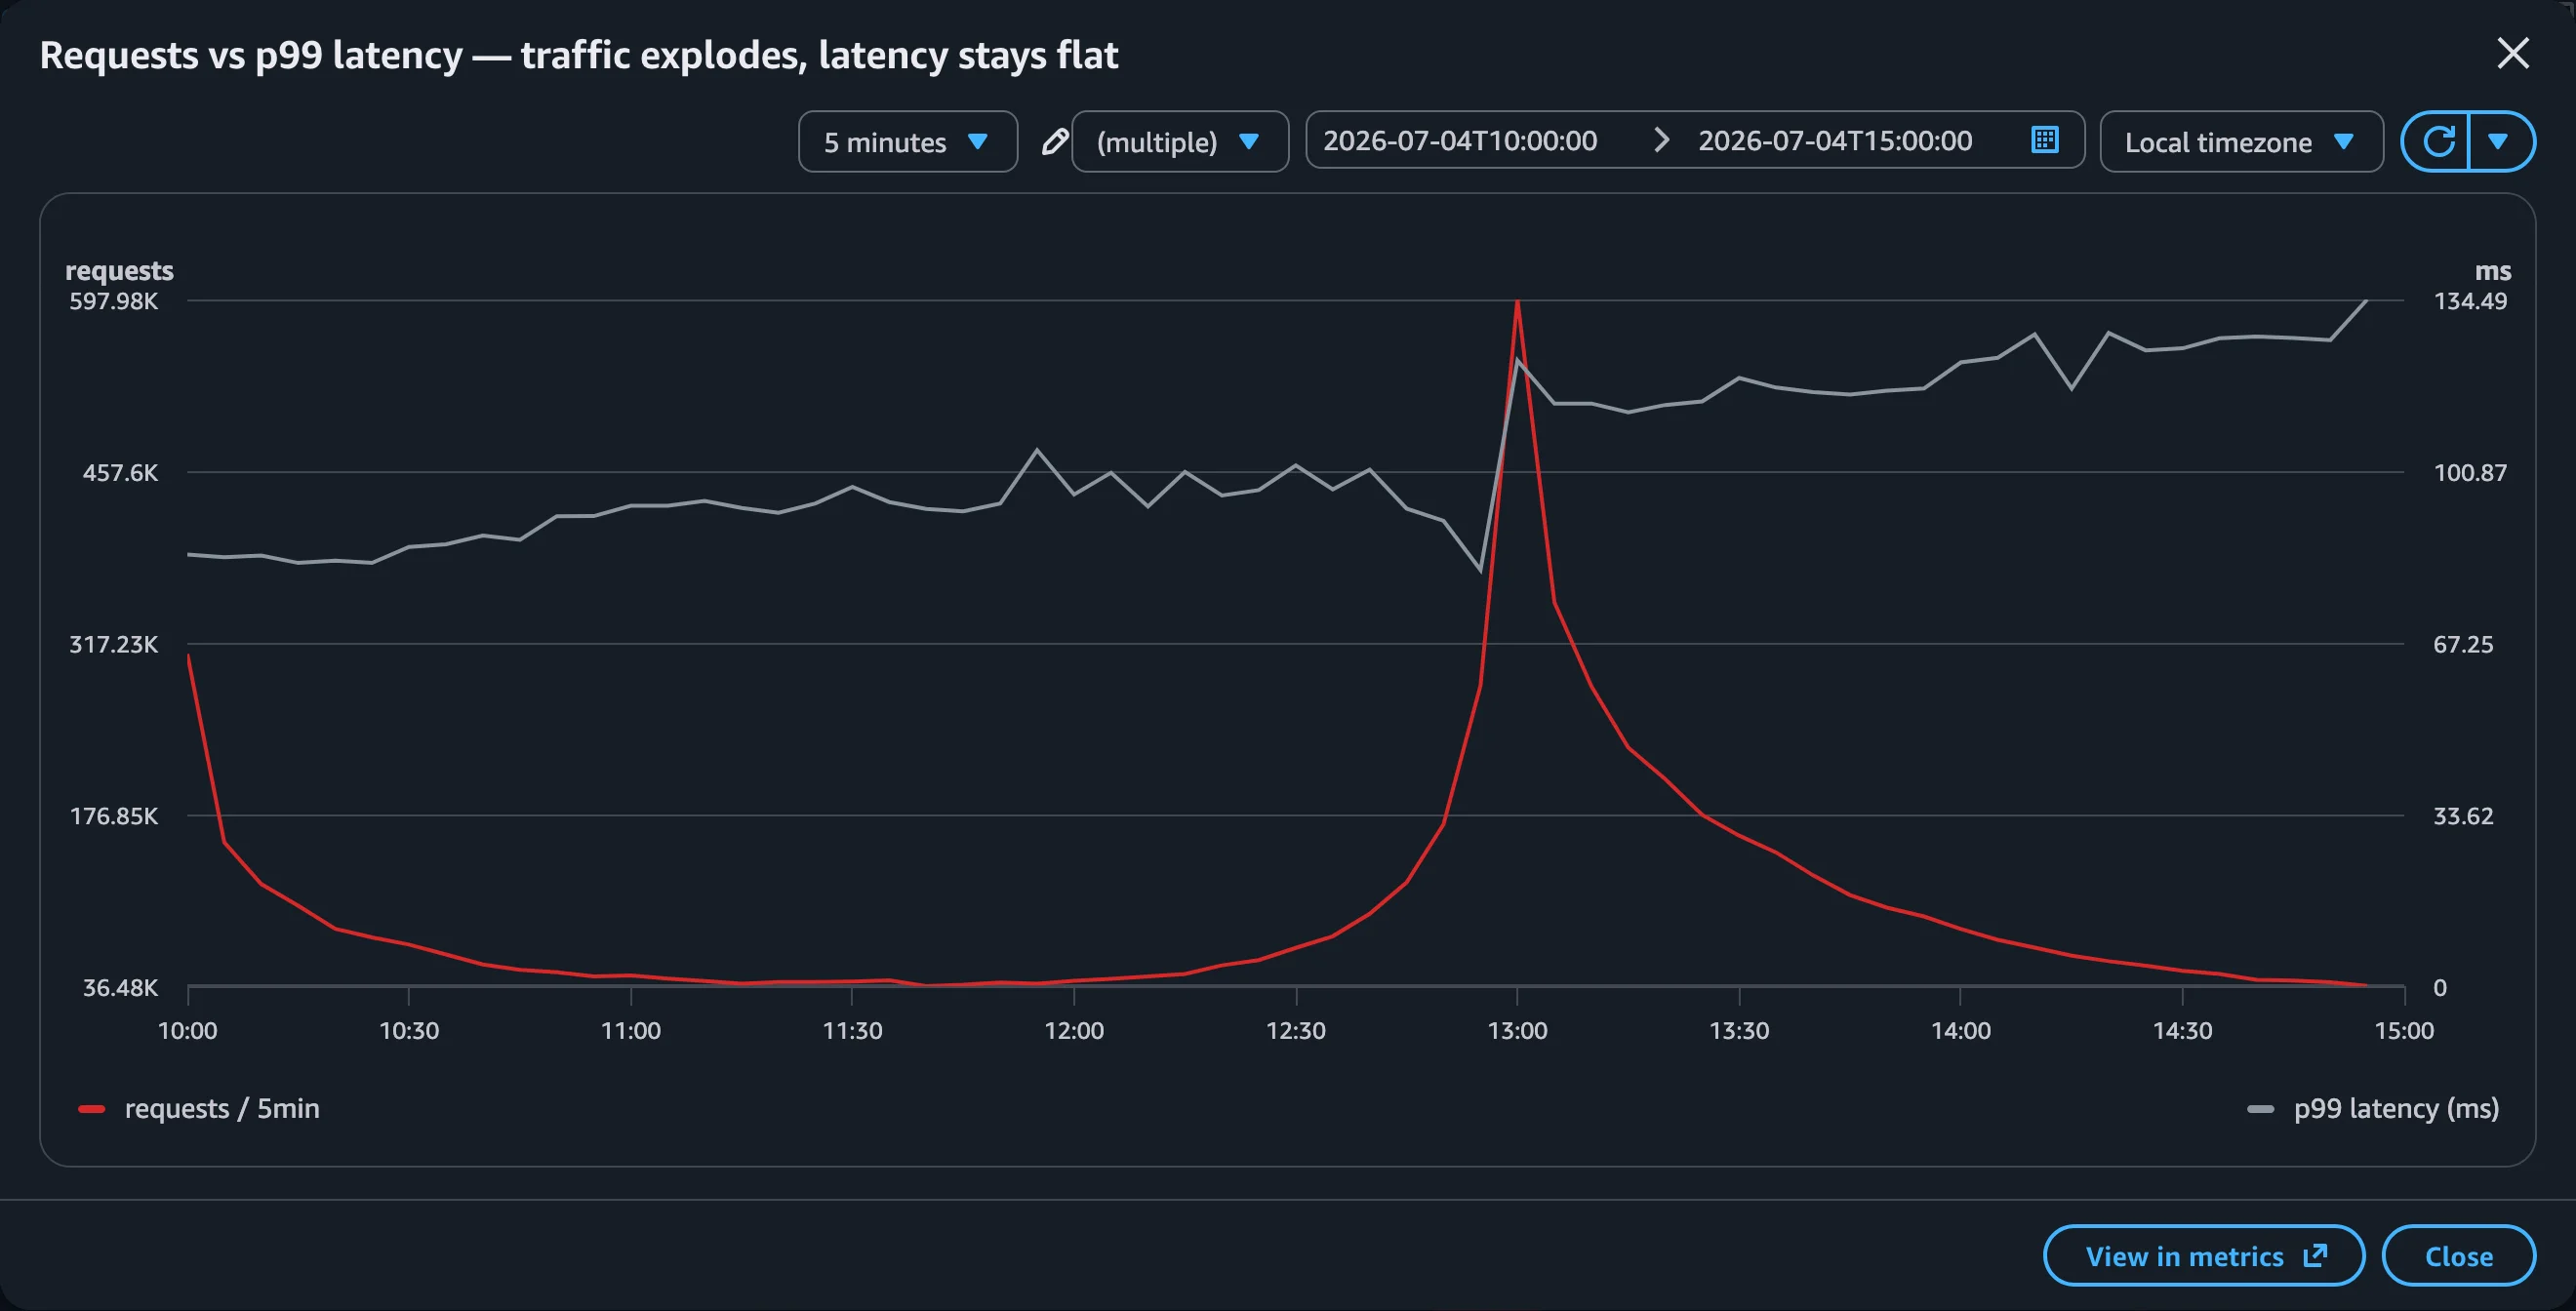 Two waves, one afternoon — with the p99 latency line laid over the top. The traffic peak is a cliff; the latency line barely notices it. That flat grey line under the 1 PM spike is the whole point: 3,244 requests a second, still answered in ~122 ms.
Across the two busiest days combined, the platform served close to eleven million requests, peaking at that 3,244-per-second minute, and — the part that's easy to miss in the big numbers — it stayed fast: 99% of all requests came back in about an eighth of a second, and 99.95% of them succeeded. From a site that spends most of the year practically asleep.
Want to verify any of this yourself? Every number in this post comes straight out of CloudWatch. I've dropped the exact queries in the Run the numbers yourself section at the bottom, and the screenshots throughout are the raw graphs those queries produce.
Last time, we hit 13,000 requests a second
Here's where it gets interesting. This wasn't the biggest advising day we've ever had. Not even close.
Last term — 23 February, spring intake — the CSE and DS wave alone was brutal. During the peak hour (14:20–15:20) the platform handled about 1,569 requests per second, totaling 5.65 million requests in sixty minutes. And in the single busiest minute, 14:30, we logged 788,816 requests — roughly 13,100 requests every second.
Thirteen thousand a second. For two departments. That's the number that made me stare at the dashboard.
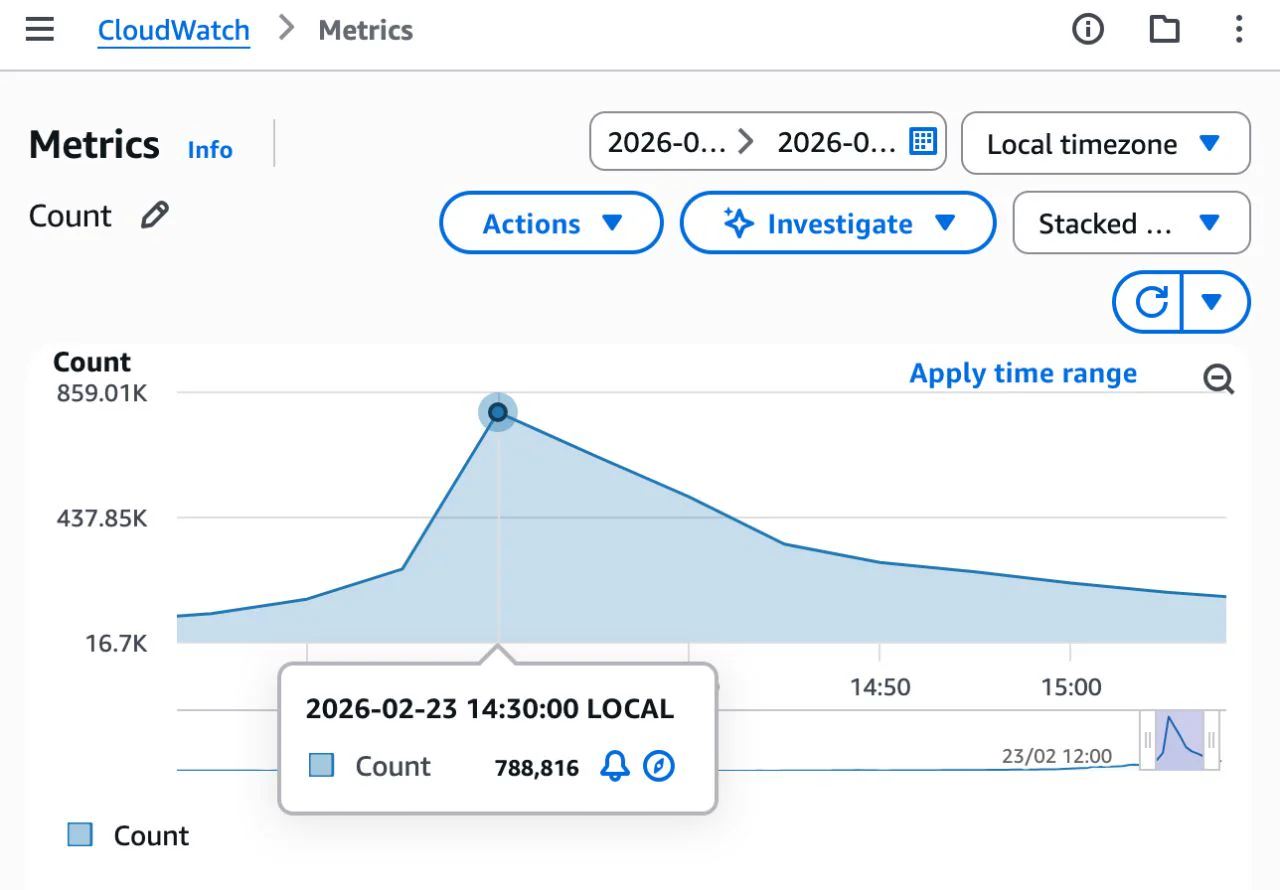 Spring's peak minute in CloudWatch: 788,816 requests at 14:30 — about 13.1K requests/second, CSE and DS only.
So when summer's CSE/DS wave peaked at only 3,244 requests a second, my first reaction wasn't relief. It was suspicion. Where did three-quarters of the traffic go?
Then we taught it to tell humans from scripts
The answer: most of that spring spike was never real students to begin with.
Advising day has a dark side. A seat in the right section is valuable enough that people write scripts to grab it — hammering the select endpoint the instant it opens, retrying in a tight loop, some of it running long before the window even unlocks. A big chunk of "13,000 requests a second" was automated brute force, not thirty thousand humans politely clicking a button.
Between spring and summer we shipped two defenses: bot detection on the selection path, and a login captcha (Cloudflare Turnstile) in front of authentication. The captcha makes a script prove it's a browser with a human behind it before it can even get a token; the bot detection flags and blocks the pre-open hammering pattern at the door.
The effect on the same advising wave, the same two departments, one term later:
| Metric (CSE + DS Wave) | Spring '26 (23 Feb) | Summer '26 (4 Jul) | Change |
|---|---|---|---|
| Peak requests / second | ~13,147 | ~3,244 | −75% |
| Peak-minute requests | 788,816 | 194,619 | −75% |
| Peak-hour requests | 5.65M | 2.58M | −54% |
| Peak-hour average requests / second | ~1,569 | ~717 | −54% |
Source: UCAM Cloud internal analytics.
 Same wave, same departments, one term apart. The defenses cut the peak by three-quarters.
I want to be honest about the caveat: not all of that drop is bots. Summer cohorts are smaller than spring, so some of the reduction is just fewer real students. But the part that vanished — the vertical wall of pre-open, machine-gun retries in the seconds before the window opened — is exactly the pattern the defenses target. Real students still showed up in force. The scripts mostly didn't get through the door. Fewer requests, the same seats filled, a calmer afternoon.
The first minute is the whole game
Advising day traffic isn't a wave you can lean into — it's a wall you hit at t=0. The instant the window unlocks, every student who's been sitting on the page refreshing slams "select" in the same breath. The API is the front door, and it takes that full blow first — before a single seat is checked or a row is written.
You can see it in the shape of the thing. At 1 PM the platform went from a calm ~1,300 requests a second to its 194,619-request peak minute almost vertically — and then, sixty seconds later, it had already dropped by a third:
| Minute (1 PM Open) | Requests | ~Requests/Second |
|---|---|---|
| 12:59 | 79,266 | ~1,321 |
| 13:00 | 194,619 | ~3,244 |
| 13:01 | 128,752 | ~2,146 |
| 13:02 | 97,520 | ~1,625 |
Source: UCAM Cloud internal Cloudwatch analytics.
The entire crisis is the opening minute. Survive that, and the rest of the afternoon is a long, tired glide back down. It's why the API layer matters more than anything behind it: everything downstream — the seat checks, the database, the live seat-count broadcasts — only ever sees the traffic the front door already let through. The API has to eat the raw spike undiluted, and the first sixty seconds is where it either holds or it doesn't.
What "fast" actually means here
"Fast" is easy to say, so here are the real numbers, straight off the response-time graph:
- Half of all requests finished in about 15 milliseconds.
- 90% finished under 30 milliseconds.
- 99% — the number I actually watch — came back in about 127 milliseconds, roughly an eighth of a second.
And here's the part I find genuinely satisfying: those numbers barely moved when the flood hit. For most of the afternoon the 99th-percentile response time sat around 85–100 ms. At the absolute peak — 3,244 requests a second — it rose to about 122 ms. That's the whole penalty for the busiest minute of the term. The traffic graph is a cliff; the latency graph is a gentle hill.
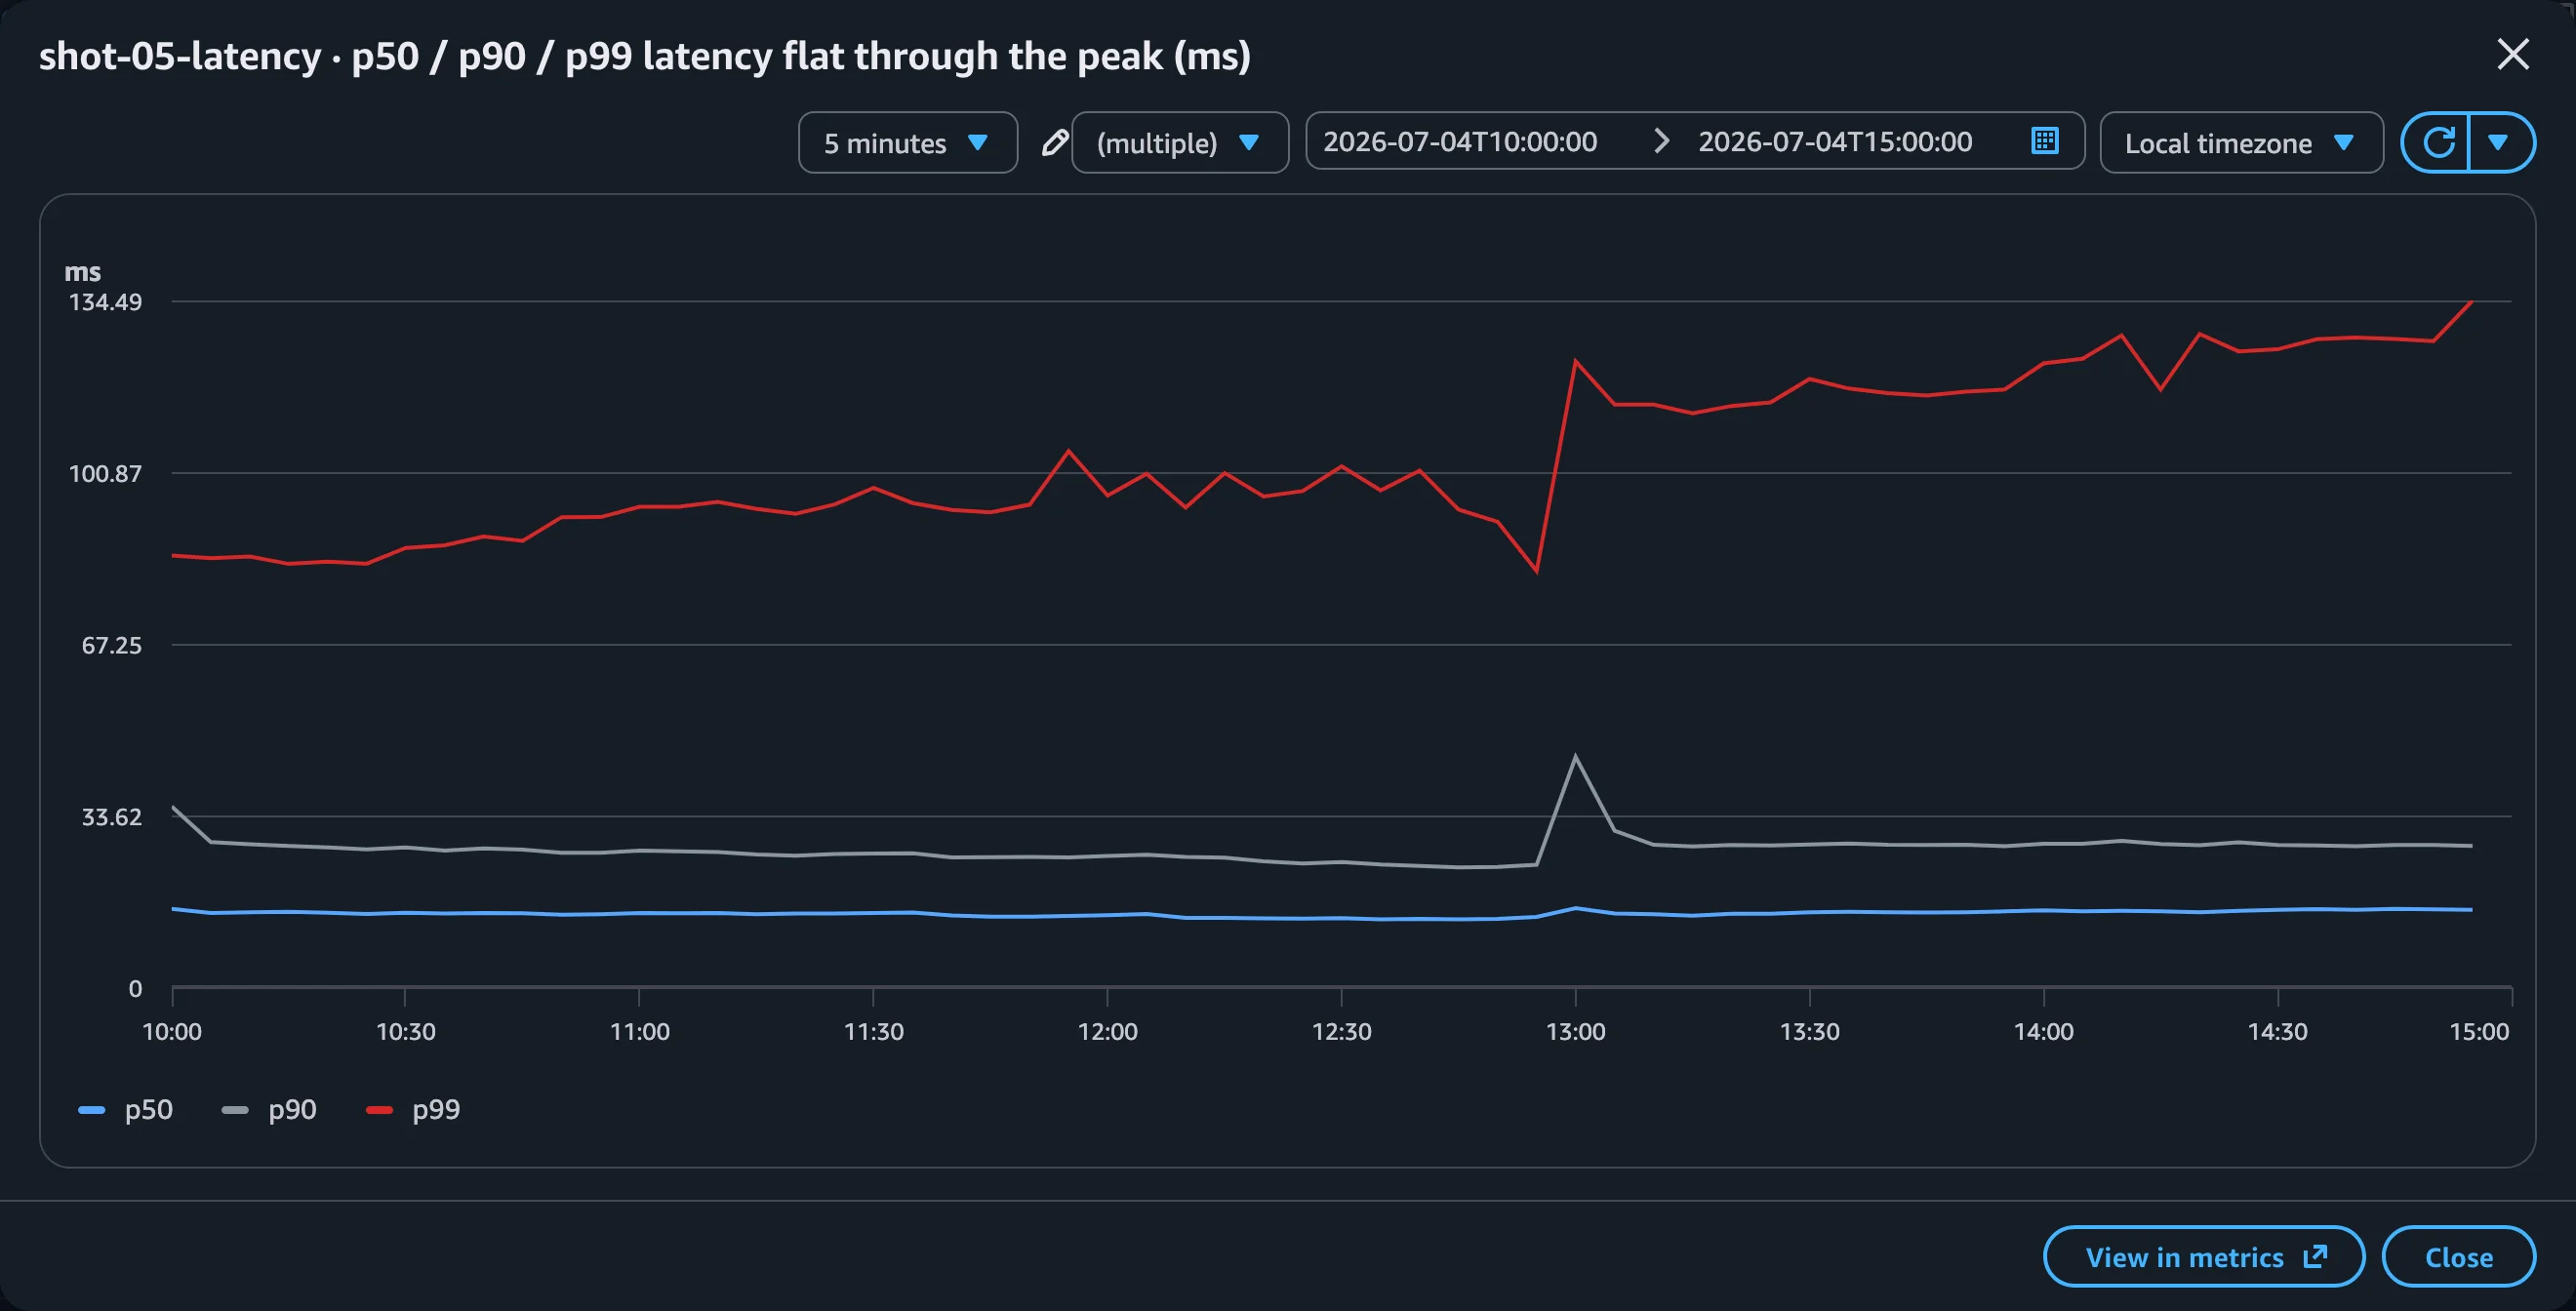 Response-time percentiles across the whole window. Even at the peak, p99 holds near 122 ms — the flat line under the storm.
It wasn't flawless, though, and I won't pretend it was. The tail always frays under this kind of load: a small fraction of requests in the very worst seconds took multiple seconds to answer, usually the ones that collided on the exact same hot section and had to line up for it. And for a few seconds at the top of the 1 PM wave, a handful of students had to tap "select" twice before it went through — no lost seats, no wrong data, just a brief "try that again" at the exact peak. The cause was mundane: we cap how many copies of each service can run at once, and a couple of those caps were still tuned conservatively from an era when our ceiling was ten times lower. The headroom is there now; the caps just hadn't caught up. A one-line fix for next time, and exactly the kind of thing advising day exists to teach you.
The seats were real
The number I actually care about most isn't throughput. It's correctness.
When two students go for the last seat in a section at the same millisecond, exactly one should get it. Not both. Not "both, we'll sort it out later." A seat shown as taken has to be taken.
This term, students claimed 37,096 seats in a few frantic minutes, and not one was oversold. Every "sorry, that section is full" was true at the exact moment it appeared — and you can see it in the data: every full-section rejection shows the section sitting at exactly its limit (45 of 45, 40 of 40), never one over. When a section hit its cap, it stopped, cleanly, every time. That invisible correctness is the whole ballgame, and it's the work nobody ever thanks you for.
Run the numbers yourself
None of this is hand-waving — here's how to pull each figure straight from CloudWatch. Set API_NAME to your API Gateway name and LOG_GROUP to your selection service's log group first. Times are UTC (the summer advising window ran 04:00–09:00 UTC = 10 AM–3 PM local).
Total requests + the shape of the day — the two-wave graph up top:
# 5-minute buckets across the whole window → the two-wave curve
aws cloudwatch get-metric-statistics \
--namespace AWS/ApiGateway --metric-name Count \
--dimensions Name=ApiName,Value="$API_NAME" \
--start-time 2026-07-04T04:00:00Z --end-time 2026-07-04T09:00:00Z \
--period 300 --statistics Sum \
--query "sort_by(Datapoints,&Timestamp)[].[Timestamp,Sum]" --output text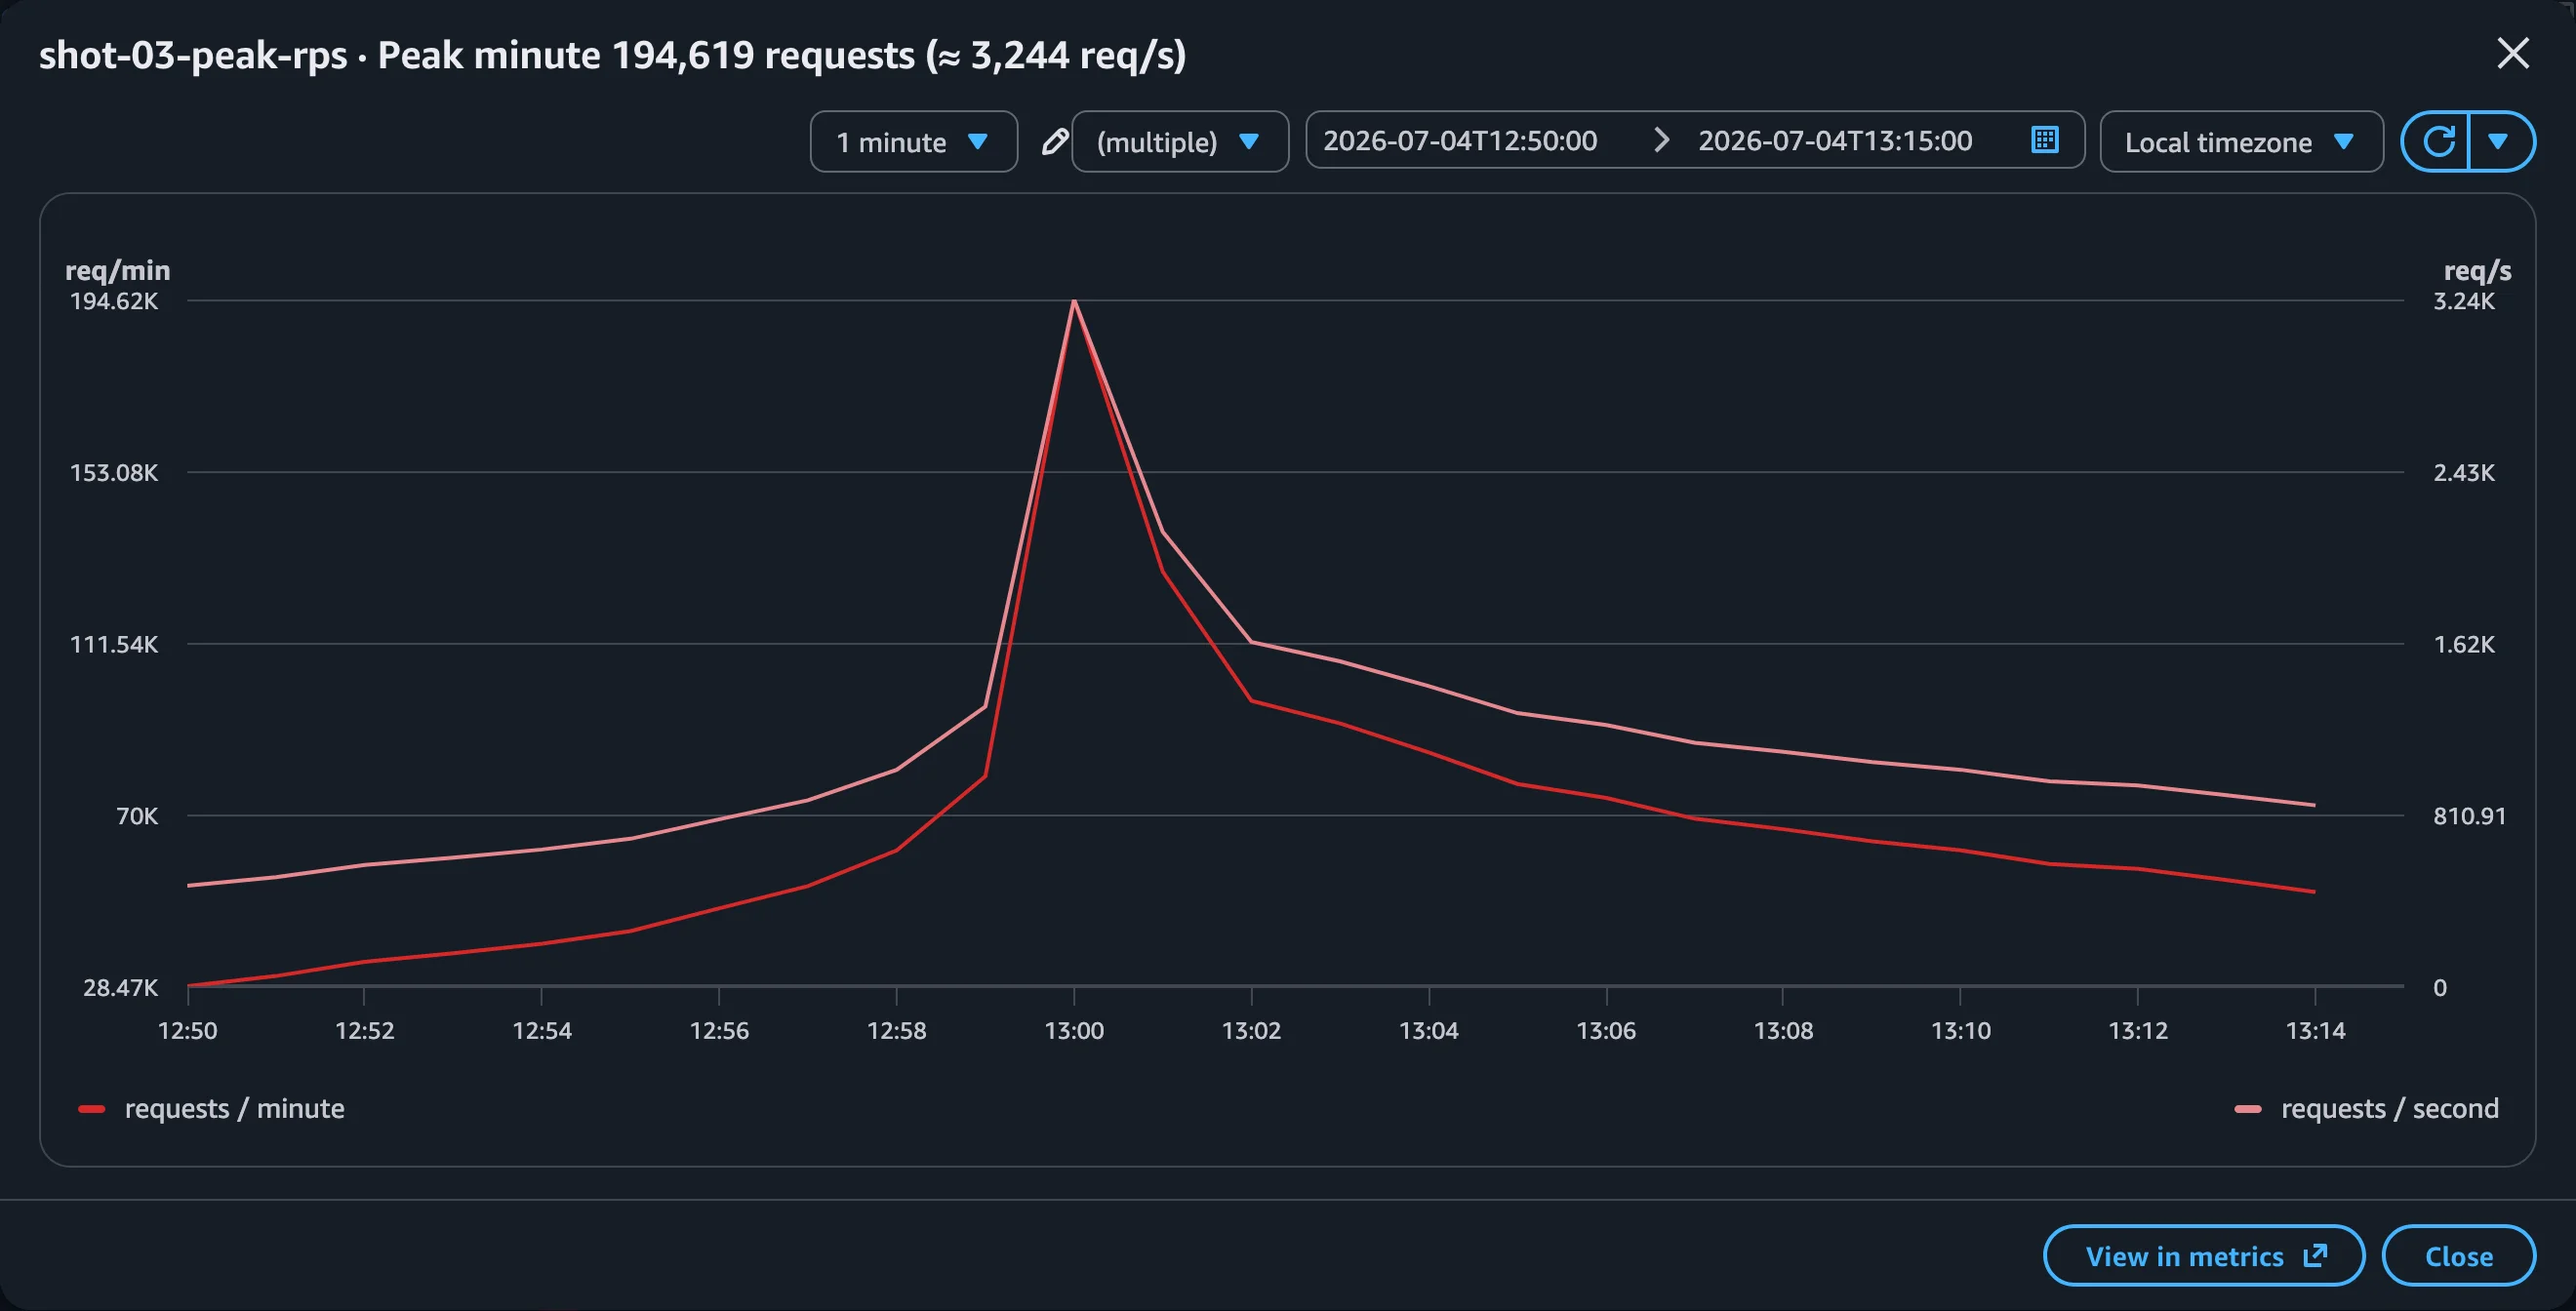 The whole afternoon in CloudWatch — screenshot of the request-count metric across the window.
Peak requests per second — the headline 3,244/s:
# 1-minute buckets around the 1 PM open; divide the max by 60 for req/s
aws cloudwatch get-metric-statistics \
--namespace AWS/ApiGateway --metric-name Count \
--dimensions Name=ApiName,Value="$API_NAME" \
--start-time 2026-07-04T06:55:00Z --end-time 2026-07-04T07:10:00Z \
--period 60 --statistics Sum \
--query "reverse(sort_by(Datapoints,&Sum))[:3].[Timestamp,Sum]" --output text
# 194619 / 60 ≈ 3244 requests/second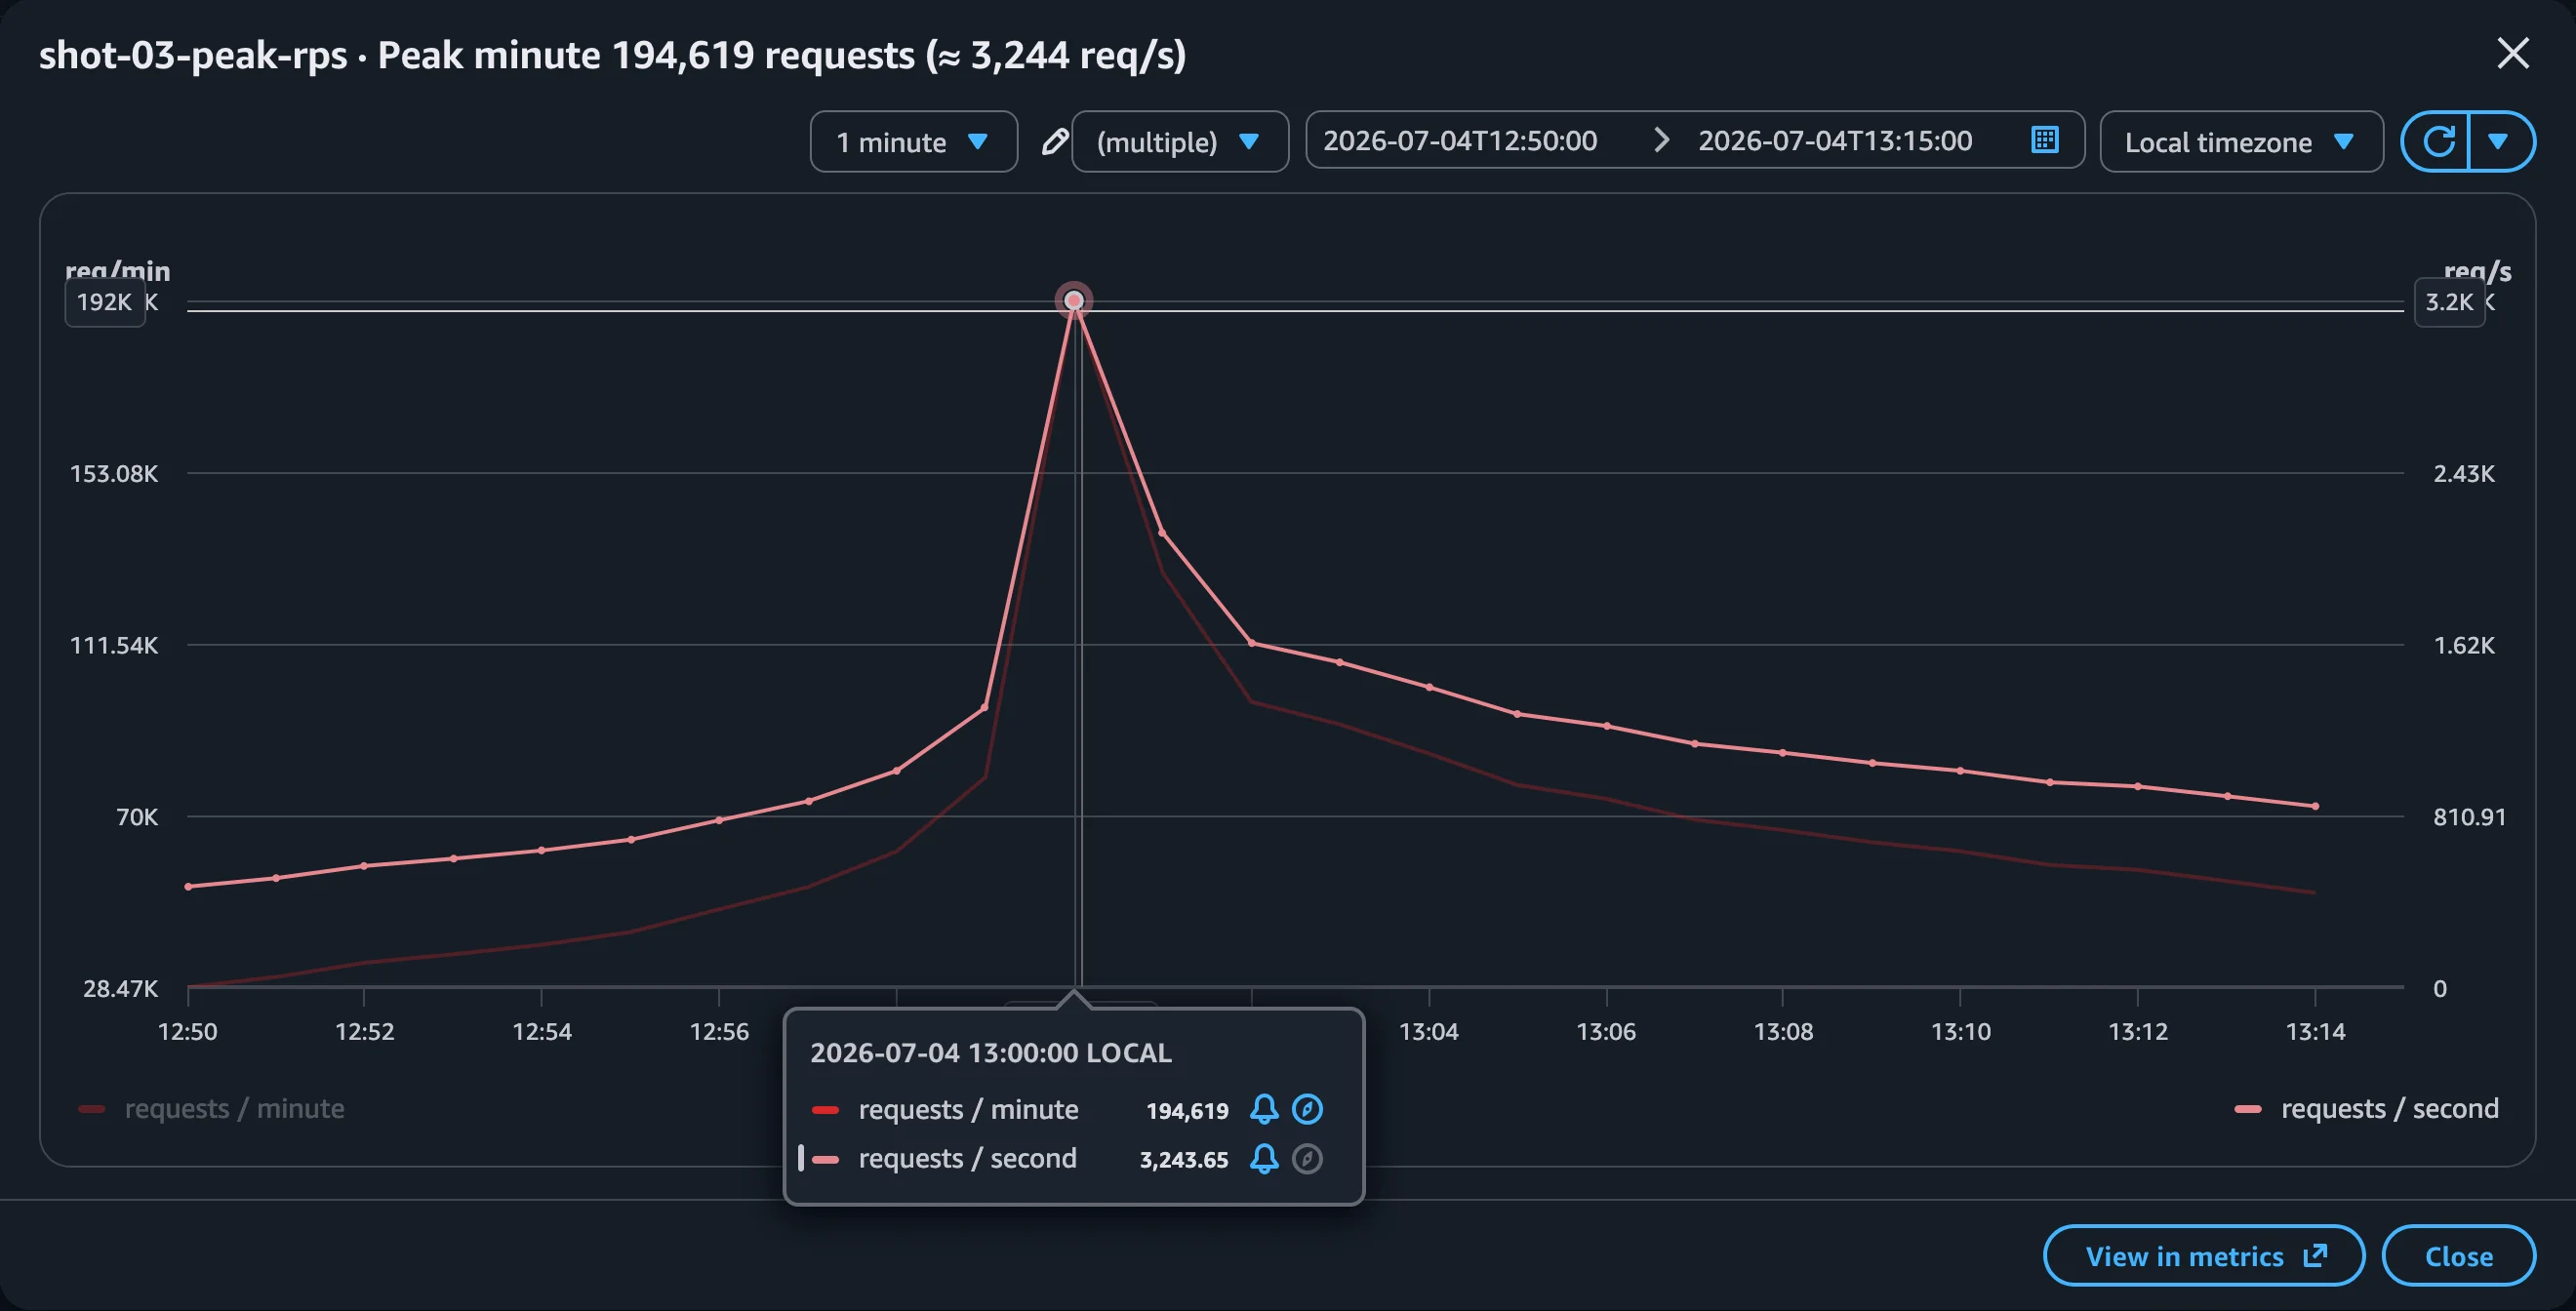 The peak minute, zoomed in: 194,619 requests in one minute ≈ 3,244 requests/second.
Latency — proof it stayed fast under all that:
aws cloudwatch get-metric-statistics \
  --namespace AWS/ApiGateway --metric-name Latency \
  --dimensions Name=ApiName,Value="$API_NAME" \
  --start-time 2026-07-04T04:00:00Z --end-time 2026-07-04T09:00:00Z \
  --period 18000 --extended-statistics p50 p90 p99
# p50 ~15ms · p90 ~29ms · p99 ~127ms across the entire window
Seats claimed, and zero oversell — from the selection service logs:
# start a Logs Insights query, then read the result
aws logs start-query \
--log-group-name "$LOG_GROUP" \
--start-time $(date -u -d '2026-07-04T04:00:00Z' +%s) \
--end-time $(date -u -d '2026-07-04T09:00:00Z' +%s) \
--query-string 'filter @message like "section selection completed" | stats count() as seats_claimed'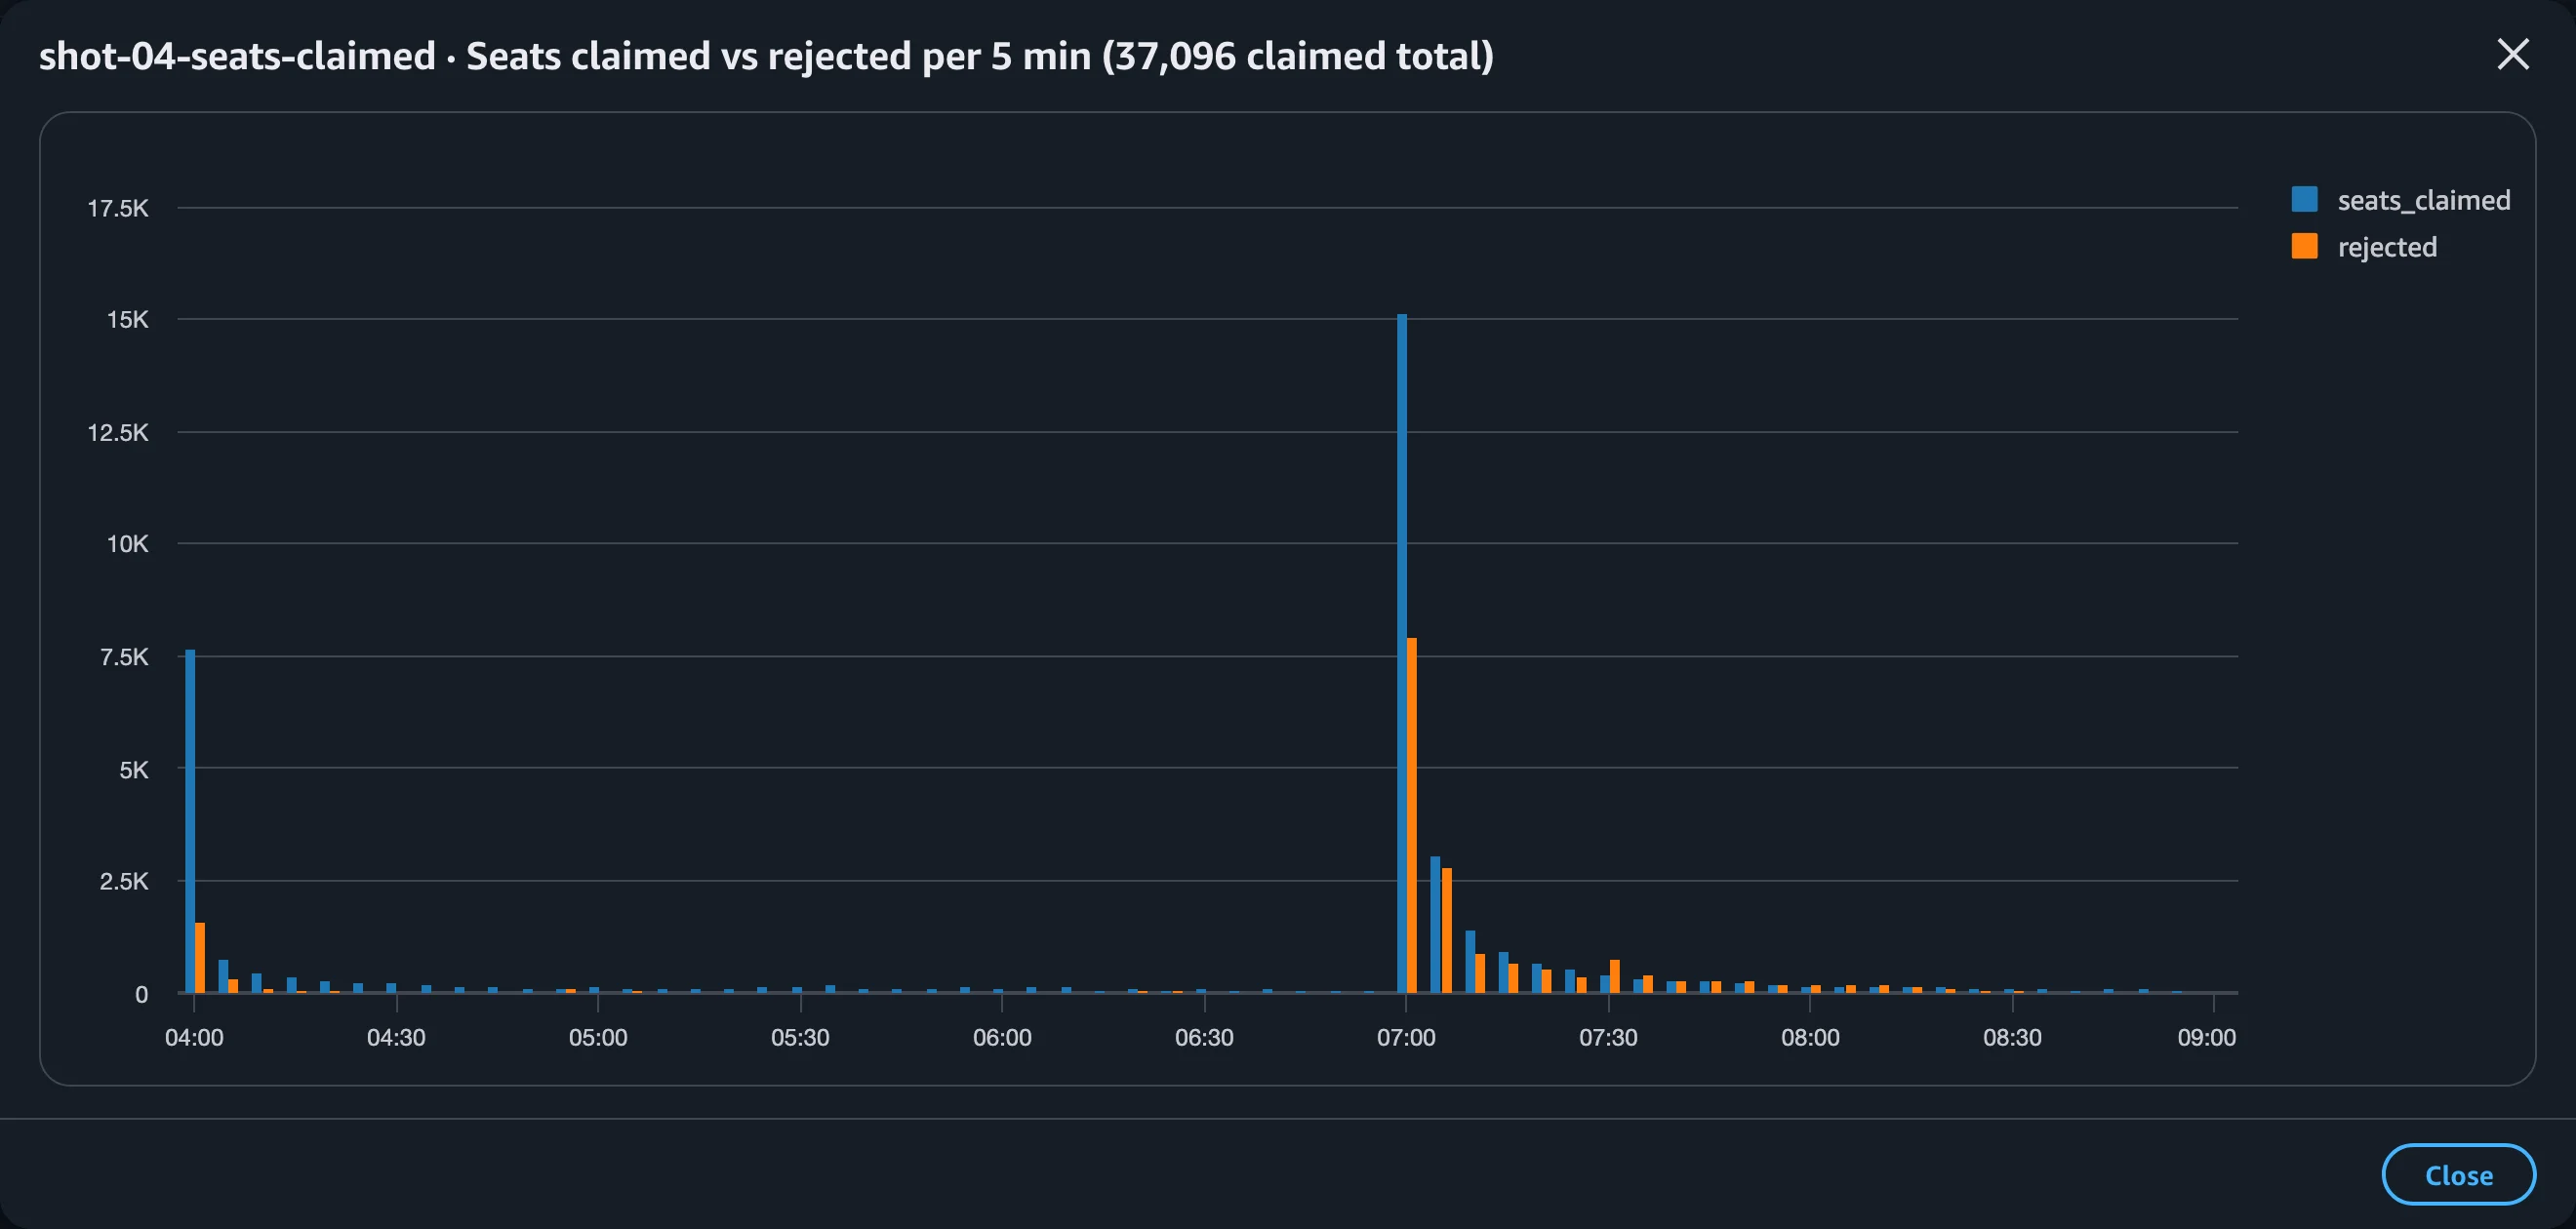 Logs Insights: every successful seat placement in the window — 37,096 of them, none oversold.
Takeaways
A few things I keep coming back to:
- Average load tells you nothing about a day like this. A system that's asleep 360 days a year and mobbed for five hours isn't "low traffic" — it's the hardest kind of traffic there is, and you have to design for the worst minute, not the average one.
- Sometimes the best performance win is serving fewer requests. We didn't make the platform four times faster between terms; we stopped four-fifths of the peak from being bots in the first place. A captcha and a detection rule bought more headroom than any amount of tuning would have.
- Correct is the feature. Nobody notices the seat that didn't get double-booked. That silence is the product working exactly as it should.
Most of the year, this thing looks like a sleepy little site nobody uses. For one wild afternoon every four months, it's thousands of people, millions of requests, a swarm of scripts trying to jump the line — and a whole lot of seats that had better be real. This time, they were. That's the job.