
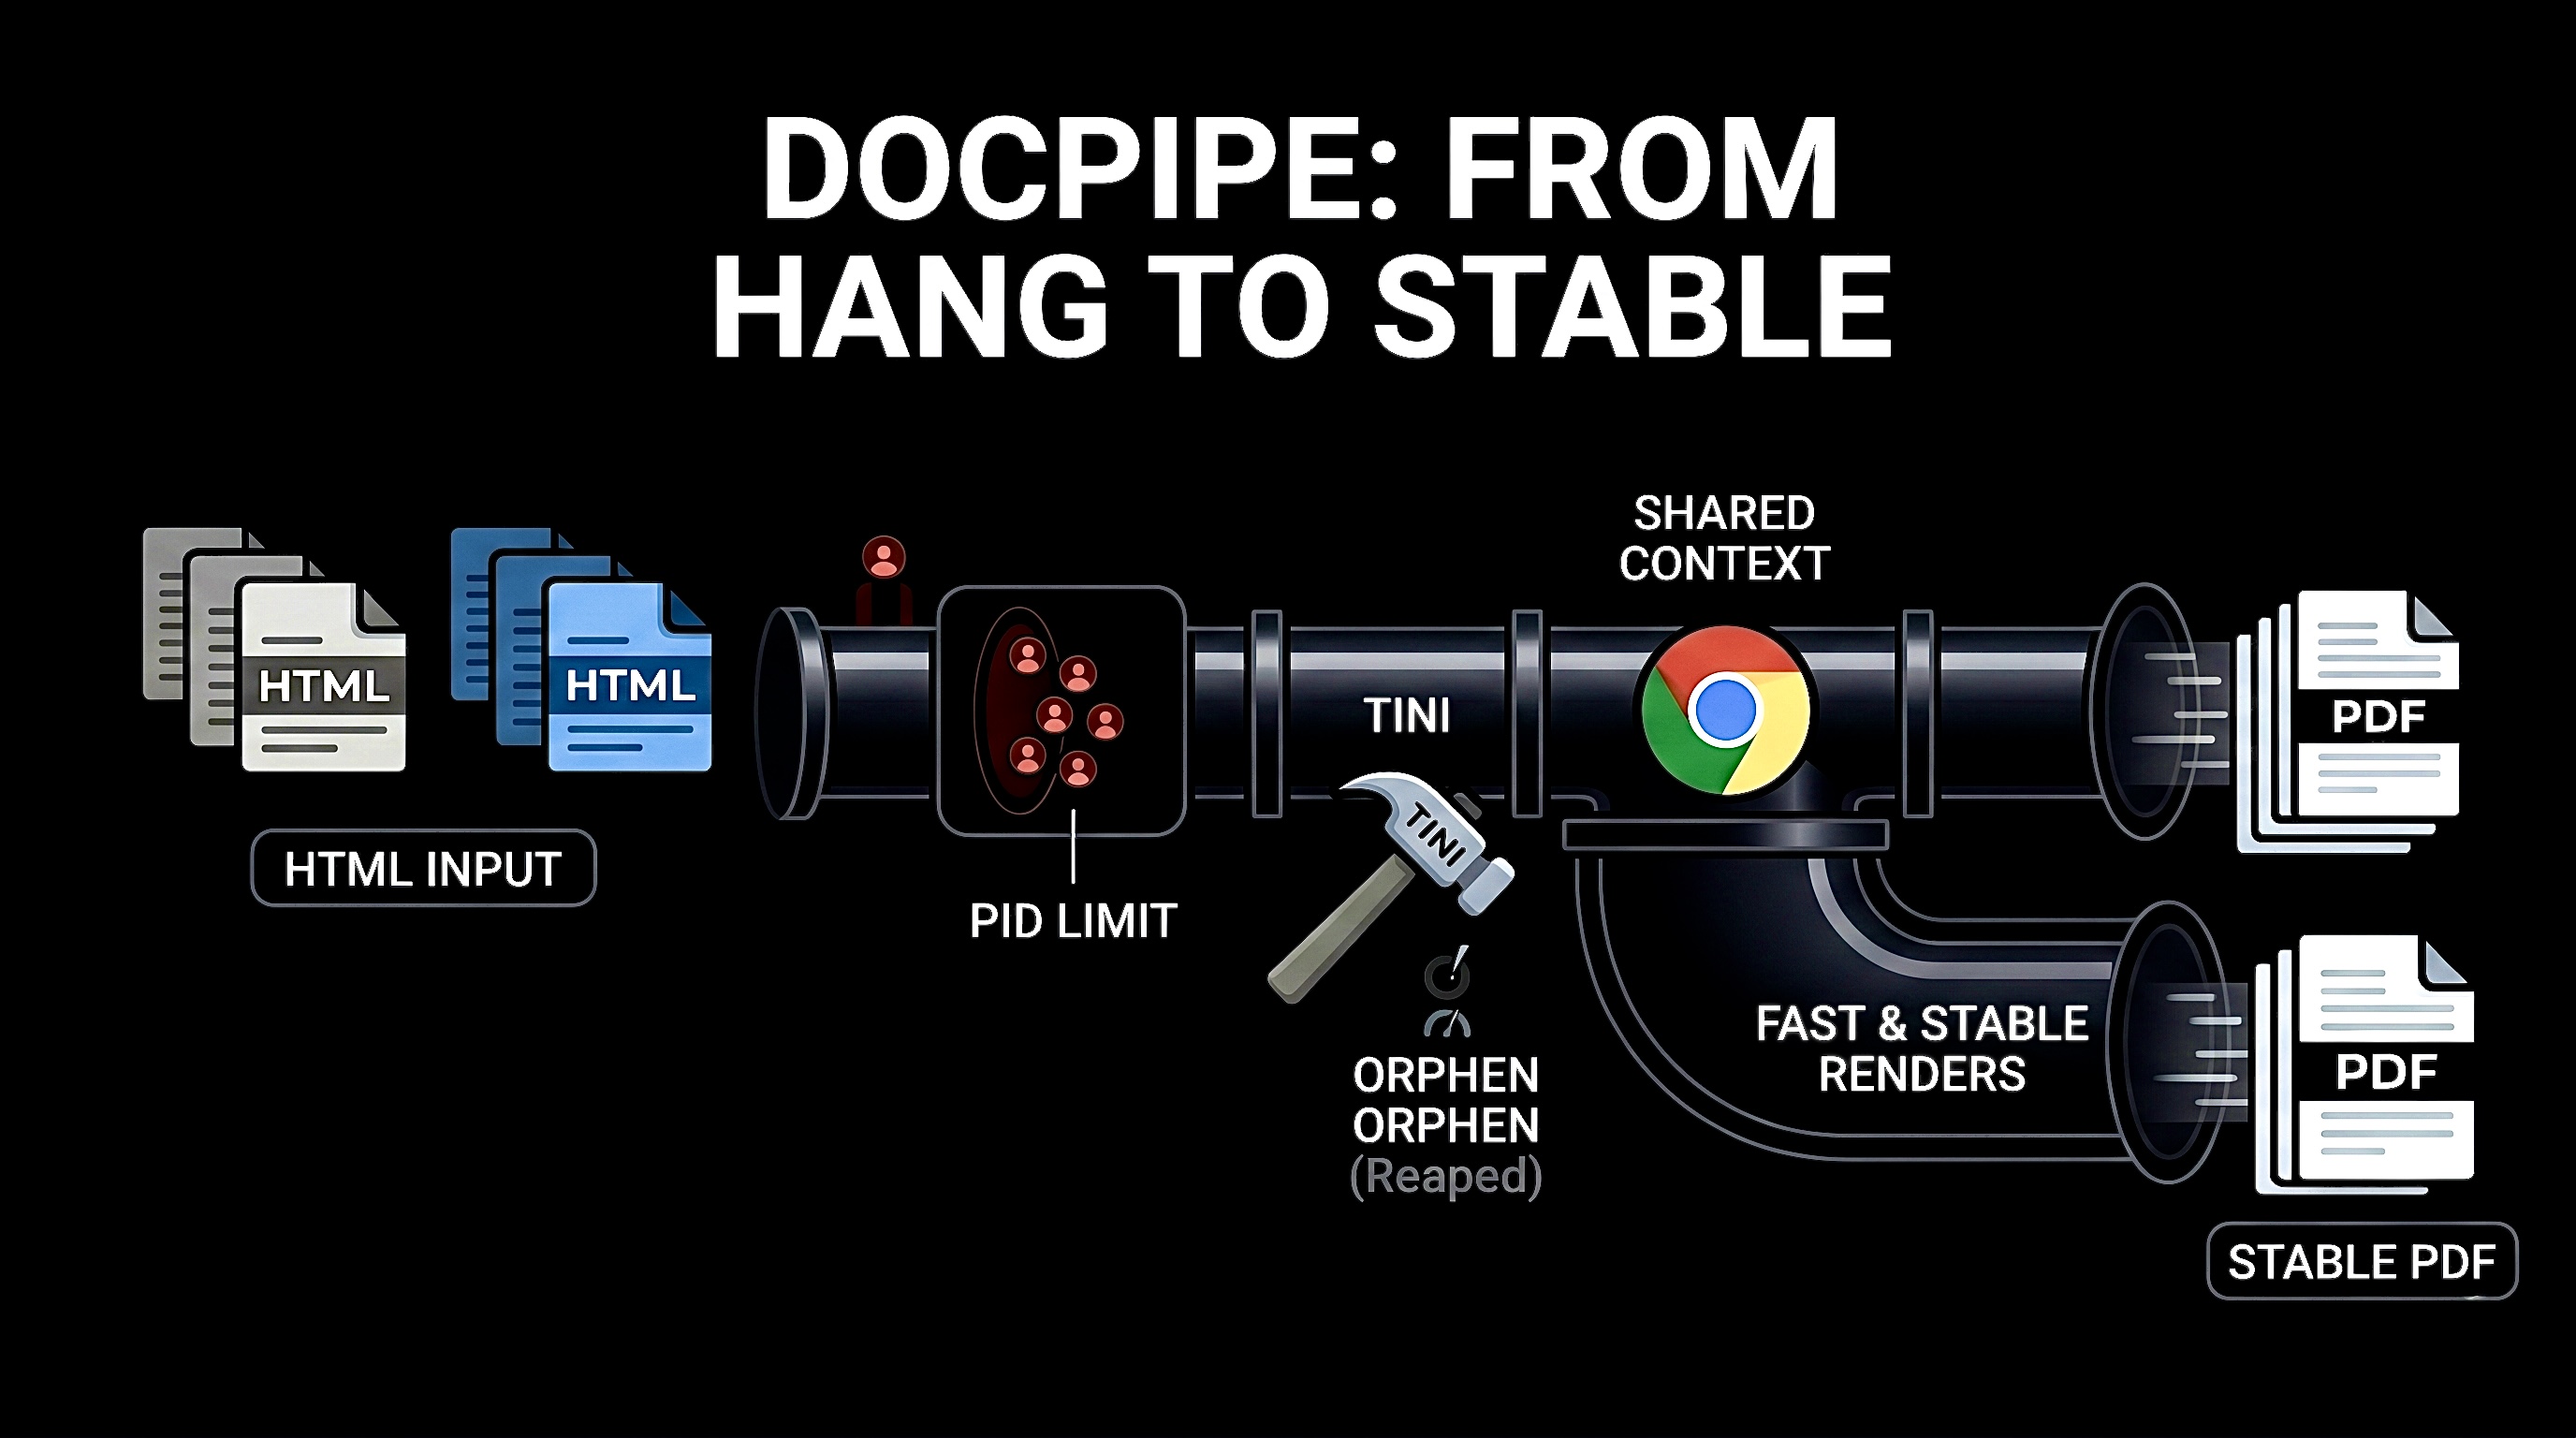
DocPipe converts HTML to PDF over a simple authenticated HTTP API. It runs as one container, serves the CASCK job portal in production, and ships its own public analytics dashboard.
The v2 rebuild — replacing a brittle single-file v1 that hung under sustained load — was an exercise in turning a personal project into something operationally honest: one long-lived browser process, a fixed concurrency cap, lock-free analytics with disk persistence, redacted public stats, and a soak test that asserts zero zombie processes before every release.
What it does
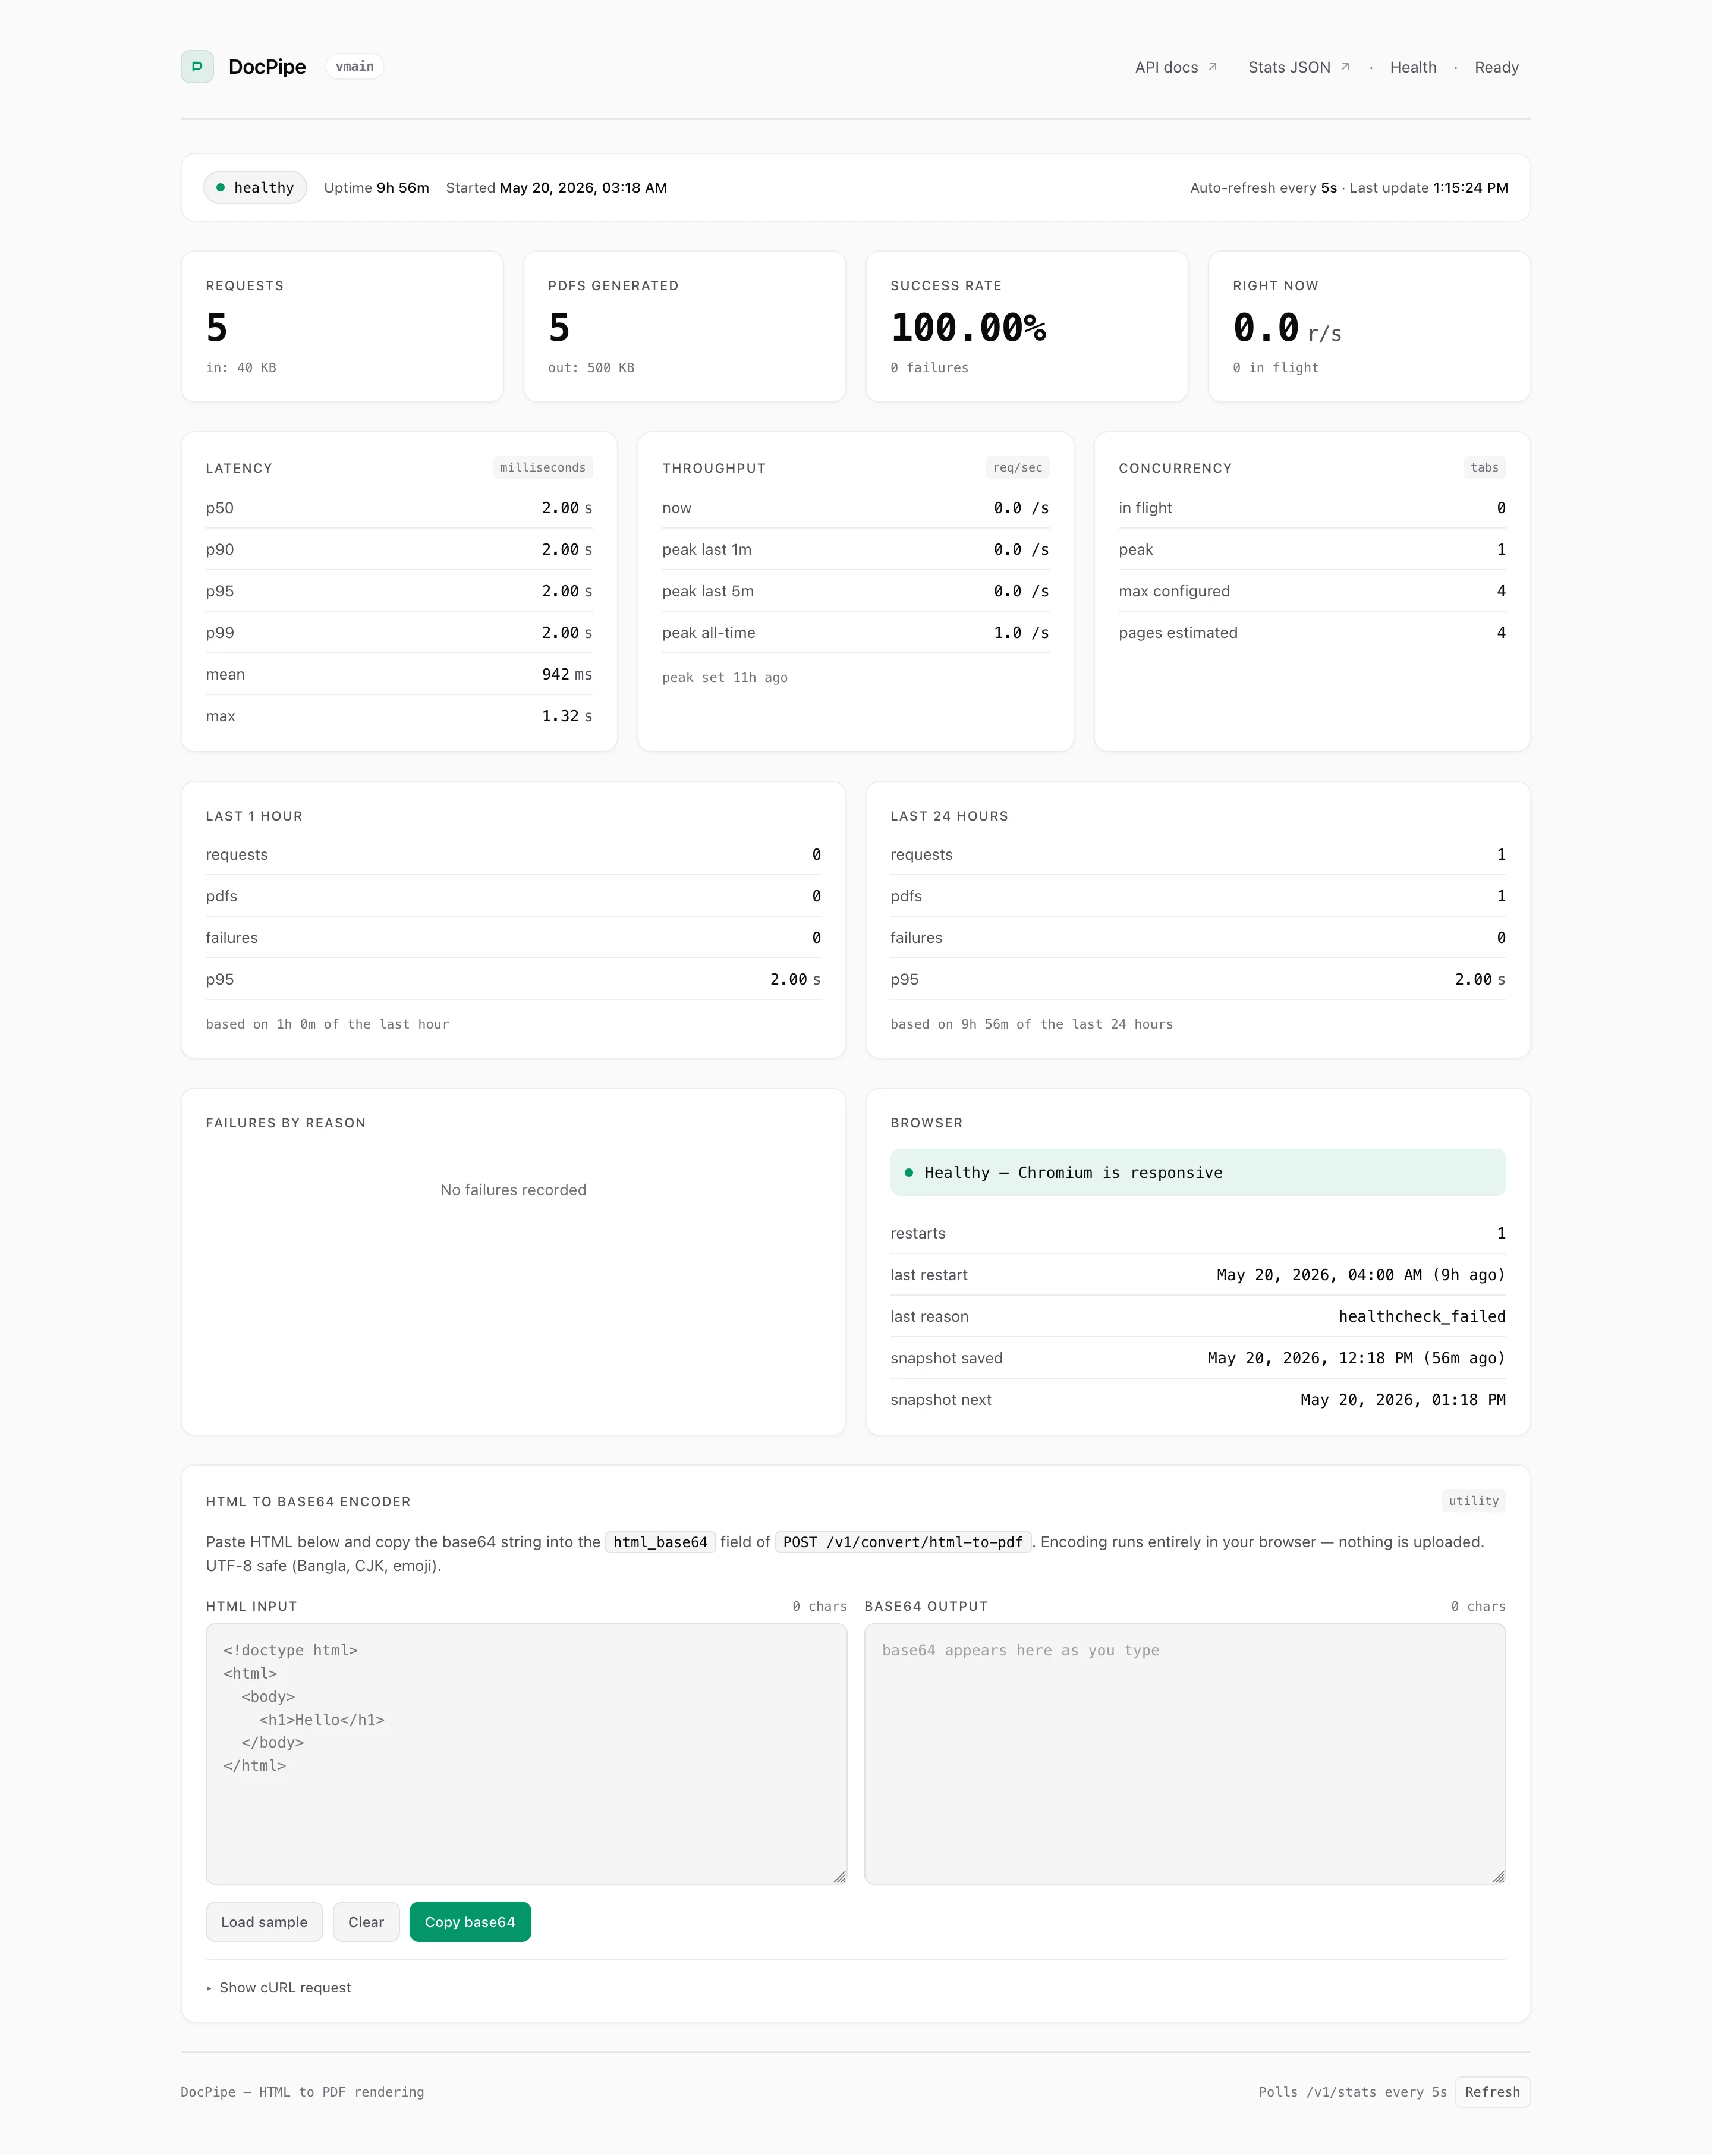
POST /v1/convert/html-to-pdf— submit HTML (raw or base64), receive a PDF. Negotiate between raw PDF bytes and a base64-wrapped JSON envelope viaAccept.POST /api/html-to-pdf— backwards-compatible v1 shim with deprecation headers, kept alive until the portal team migrates.GET /v1/stats— public, redacted observability snapshot: lifetime totals, latency percentiles, RPS, browser health, rolling 1h / 24h windows.GET /v1/stats/dashboard— single-page HTML dashboard, vanilla JS, no framework, no CDN, polls/v1/statsevery 5 seconds.GET /healthz,/readyz— liveness and readiness (the second one reflects actual browser health).
OpenAPI 3.1 spec is hand-written and served via Swagger UI in development.
What's notable about it
One long-lived Chromium process. Per-request tabs derive from a shared parent context. A semaphore caps concurrent renders. A supervisor goroutine probes Chromium every 30 seconds and recycles it on failure or after a configurable render count. The bug that hung v1 — Chrome zombies accumulating until fork() failed — is structurally impossible in v2.
tini as PID 1. The other half of the hang fix. Application binaries make poor PID 1s; they don't reap orphaned grandchildren. tini costs nothing and prevents an invisible failure mode that takes weeks to surface.
Lock-free analytics with atomic persistence. Fixed-bucket histograms with atomic.Int64 writes, a 60-slot sliding-window RPS tracker, and 1440-slot rolling windows for 1h / 24h aggregates. Snapshots write to state.json.tmp, fsync, then rename — POSIX-atomic. On startup, the snapshot replays; on corruption, it's archived aside and the service starts fresh rather than crashing.
Public stats redact by construction. A dedicated function in analytics/public.go is the single boundary that emits data to the network. Per-key counts, key names, request IDs, client IPs, and hostnames never cross it. The Recorder struct itself is never serialised.
Soak test as the regression gate. Every release runs 1000 sequential plus 50-wide parallel waves for 10 minutes, asserts zero zombies inside the container, RSS within 100MB of baseline, and analytics totals matching what was sent. The v1 hang doesn't manifest at low volume; the soak proves the fix at production scale.
How it's deployed
- Image:
ghcr.io/monzim/docpipe— multi-arch (linux/amd64,linux/arm64) with provenance and SBOM attestations. - Base:
chromedp/headless-shellplustiniand the Noto font set for Bangla / CJK / emoji rendering. - Runtime: Non-root UID 10001, all capabilities dropped,
no-new-privileges,shm_size: 1gb. Persistent volume on/app/datafor the analytics snapshot. - CI: GitHub Actions —
go vet,gofmt,go test -race, then the Docker workflow builds multi-arch and pushes to GHCR on every push tomainplusv*.*.*tags. Dependabot grouped weekly for actions, Go modules, and the base image.
Stack
- Language: Go 1.26 with
log/slog - HTTP:
go-chi/chiplusgo-chi/cors - Browser:
chromedp/chromedpv0.15 +cdproto - Rate limiting:
golang.org/x/time/rate - IDs:
oklog/ulid - Container:
chromedp/headless-shell+tini+ Noto fonts - Registry: GHCR with multi-arch manifests + provenance attestations
- CI: GitHub Actions with Dependabot grouped updates
What I'd change
The renderer pool is currently shared across tenants — a noisy caller can hold semaphore slots up to the timeout and starve others. A weighted-fair-queueing scheme over the semaphore would fix this; v2 deliberately ships without it. Fixed-bucket histograms also give coarse tail percentiles; a t-digest behind the same Observe(int64) interface would swap cleanly when the dashboard view stops being sufficient.
Both decisions are documented in the architecture doc as deliberate v2 scope. They're the right places to push next, not the wrong places to have stopped.
Links
- Repository — full source
- GHCR image — pull and run
- Engineering blog: "Three bugs that hung my PDF service" — what broke in v1 and the load-bearing fixes
- Specification and architecture doc in the repo
DocPipe Analytics Dashboard
DocPipe — Architecture
This document describes the internal shape of DocPipe v2: components, data flow, lifecycles, threading, failure modes, and the file layout that backs each. It does not restate requirements — see SPEC.md for the contract.
1. System context
DocPipe sits between an upstream caller (the CASCK job portal and any other approved consumer) and a host's CPU, with no other external dependencies.

No databases. No queues. No object stores. The only persistent state is the analytics snapshot directory.
2. Package layout
cmd/docpipe/                  entrypoint, wires everything together
internal/
  config/                     env loading + validation
  observability/              slog logger setup
  httpx/                      chi router, middleware, uniform error envelope
  render/                     chromedp browser pool + PDF action
  analytics/                  counters, histograms, RPS, persistence, redacted public view
  auth/                       API key store + per-key rate limiter
  handlers/                   convert · legacy · stats · dashboard · swagger
  webassets/                  go:embed for dashboard.html + openapi.yaml
deploy/                       Dockerfile, docker-compose, chrome-flags reference
scripts/                      gen-apikey.sh, soak.sh
testdata/                     minimal · Bangla · CJK · page-rules · broken
Each internal/ package has one responsibility and a small public API. handlers/ depends on render, analytics, httpx, and auth but those leaf packages depend only on stdlib + chromedp + chi.
3. Request lifecycle (POST /v1/convert/html-to-pdf)

The middleware chain order is fixed in httpx.New per spec §9: recover → requestID → logger → bodyLimit → CORS → auth → rateLimit → analytics → timeout → handler. Analytics runs after auth and rate limit so 401/429 traffic doesn't pollute success metrics.
4. Browser lifecycle
This is the hardest piece of the system. Two facts shape it:
- chromedp binds a Chromium process to the context that first calls
Runon it. If that context is canceled, the browser dies. - Chromium spawns grandchild processes (renderer, GPU, zygote, crashpad). When
cancel()returns, those grandchildren are reaped by PID 1 — but only if PID 1 actually reaps. Go binaries don't.
The renderer addresses both:

Render path inside Browser.Render:
- Reject early if
closedorunhealthy. - Validate options.
- Increment in-flight gauge (
atomic.Add, thenCompareAndSwapto update peak). - Acquire semaphore slot or bail on
ctx.Done(). - Snapshot parent context under
RLock. chromedp.NewContext(parent)→ fresh tab.context.WithTimeout(tabCtx, opts.Timeout)→ bounded tab.runRender(tabCtx, html, opts)executes the action sequence.- Increment render count; trigger async recycle if threshold reached.
Recycle takes the write lock, cancels the old parent + allocator, calls spawn() to build a new pair, releases the lock. Concurrent renders that arrive mid-recycle see healthy=false and bail immediately rather than block.
5. PDF action sequence
The render is one chromedp.Run containing two actions: a navigate and a custom function that bundles listener-setup, HTML load, wait, and print as one atomic step.
Navigate("about:blank")       // gives us a real frame to setDocumentContent into
  │
  ▼
ActionFunc:
  startWait(ctx, opts)        // install listener BEFORE the action that fires events
  loadHTML(ctx, html)         // page.GetFrameTree → page.SetDocumentContent on root frame
  <-readyChan                 // load / networkidle / selector / none
  printPDF(ctx, opts, &out)   // page.PrintToPDF with options
The listener must attach before loadHTML because setDocumentContent fires Page.loadEventFired synchronously inside the call. Attach after, and the event has already passed — every render waits for an event that will never come.
For networkidle, the action installs both a load listener and a network listener. The network listener counts in-flight requests via network.EventRequestWillBeSent / EventLoadingFinished and signals ready after the load event + 500ms of no in-flight requests. Hitting the wait timeout is non-fatal: the network is just chatty, so we proceed to print.
HTML is loaded via CDP's Page.setDocumentContent against the root frame ID, not by mutating document.body's inner HTML — the latter discards <head>, doctype, and stylesheet links. The v1 code did this and produced cosmetically wrong PDFs whenever fonts or styles lived in head.
6. Analytics lifecycle
process start
  │
  ▼
  Replay state.json (FR-5)
    ├─ missing → first-run, log INFO
    ├─ corrupt → archive to state.json.broken.<ts>, start fresh, log ERROR
    ├─ schema_version > current → refuse to start
    └─ ok → ApplySnapshot
            ├─ load totals, failures-by-reason
            ├─ load histogram buckets (reset if boundaries mismatch)
            ├─ load all-time RPS peak + max latency + browser restart count
            └─ rolling windows start empty (do NOT survive restart)
  │
  ▼
  Start snapshot ticker (interval default 1h)
  │
  ▼
  Handle requests
    ├─ RecordRequest(key, bytesIn)
    │     atomic.Add totals.requests
    │     rps.Inc()
    │     keyStats[key].Requests.Add(1)
    ├─ RecordSuccess(key, latencyMs, bytesOut)
    │     totals.pdfs++ ; bytesOut += ; pdfSize.Observe()
    │     latency.Observe() ; max via CompareAndSwap loop
    │     rolling.Record(now, 1, 1, 0, latencyMs, 0, bytesOut)
    └─ RecordFailure(key, reason, latencyMs)
          totals.failures++ ; failuresByReason[reason]++
          latency.Observe() ; rolling.Record(...)
  │
  ▼ (every snapshot interval, also at midnight crossing, also at shutdown)
  Persist
    1. MarshalSnapshot(recorder)          ← read-side: copies atomics under no lock
    2. WriteFile(state.json.tmp)
    3. f.Sync()                            ← fsync
    4. os.Rename(tmp, state.json)         ← POSIX-atomic
    5. recorder.SetLastSnapshotAt(savedAt)
    6. if midnight crossed:
         rollupDaily(yesterday) → daily/YYYY-MM-DD.json
         prune files older than retentionDays
The recording API is small and lock-free for writers. The read side (Snapshot, BuildPublicView) takes "consistent-ish" snapshots — atomic loads in sequence — which can miss writes between loads but never reads garbage. For dashboard purposes that's fine; for billing it wouldn't be.
7. Threading model
| Goroutine | Owner | Purpose | Lifetime |
|---|---|---|---|
http.Server.Serve | httpx.Server | Accept HTTP connections | until SIGTERM |
| per-request handler | chi | Handle one request | per-request |
| Browser supervisor | render.Browser | Probe Chromium every 30s | until Browser.Close |
| Browser launch goroutine | render.Browser.spawn | Bound initial Run via select | until launch returns |
| Browser recycle goroutine | render.Browser | Tear down + rebuild on threshold/fail | per-recycle |
| Wait-strategy listeners | render.Browser.Render | Listen for load / network events | per-render |
| RPS ticker | analytics.SlidingWindow | Advance the 60-slot ring every 1s | until Recorder.Stop |
| Snapshot ticker | analytics.Store | Persist state every interval | until Store.Stop |
Concurrency primitives:
Browser.sem— buffered channel of sizeRenderConcurrency. Acquire by sending, release by receiving.Browser.ctxMu—sync.RWMutexprotecting parentCtx + parentCancel. Renders take read lock; recycles take write lock.Recorder.failuresByReason—sync.Mapofstring → *atomic.Int64.Recorder.byKey—sync.Mapofstring → *KeyStats.Histogram.counts,.sum,.count,.max—atomic.Int64. Observe is lock-free: one binary search + one atomic Add per bucket + sum/count/max CAS for max.
There are no goroutine pools; the renderer's parallelism is bounded by the semaphore, and chromedp creates per-tab goroutines internally.
8. Failure modes and recovery
| Failure | Detection | Response |
|---|---|---|
| Chromium process dies | Supervisor probe fails | Mark unhealthy, recycle, record restart with healthcheck_failed reason |
| Render exceeds tab timeout | context.DeadlineExceeded in runRender | Return render_timeout (504), cancel tab |
| Server overall timeout | TimeoutMiddleware ctx done | Return render_timeout envelope, let handler unwind into discarded writer |
| Concurrency semaphore full | Send blocks | Caller's request context times out → 504 |
| Body exceeds limit | MaxBytesReader error | payload_too_large (413) |
| Bad API key | Auth middleware compares | forbidden (403) |
| Bad rate of requests | golang.org/x/time/rate denies | rate_limited (429) with Retry-After |
| state.json corrupt | JSON unmarshal fails | Archive to state.json.broken.<ts>, log loud, start fresh |
| state.json from future | schema_version > current | Refuse to start |
| Panic in handler | RecoverMiddleware catches | Log with stack, return internal_error (500) |
| Caller disconnects mid-render | Request context cancels | Render aborts cleanly via tab context, semaphore slot released |
| Process killed (SIGKILL) | n/a | On next start, snapshot replay restores totals up to last persist |
| Graceful shutdown (SIGTERM) | Signal context cancels | Server drains 30s, analytics final flush, Chromium torn down |
The two non-recoverable failures are: refusal to start with an unknown future schema, and unrecoverable Chromium spawn errors at startup. Both fail loudly with a non-zero exit code rather than running degraded.
9. Configuration flow
process env  ──→  config.Load()                  ← validates everything, accumulates errors
                       │
       ┌───────────────┼───────────────┬──────────────┬──────────────┐
       ▼               ▼               ▼              ▼              ▼
   observability   analytics       render        auth.Store    auth.Limiter
   .New(level,    .New(version)   .New(Config)   .NewStore(    .NewLimiter(
        format)                                    APIKeys)       RPS, Burst)
                       │
                       ▼
                  store.Replay()  ← loads ./data/state.json into recorder
                       │
                       ▼
                  store.Start(ctx) ← hourly snapshot ticker
                       │
                       ▼
                  httpx.New(cfg, log,
                            WithHealthCheck(browser),
                            WithRoutes(...))      ← chi router + middleware chain
                       │
                       ▼
                  srv.Run(ctx)                    ← blocks until SIGTERM
The wiring lives entirely in cmd/docpipe/main.go — about 90 lines. Every component is constructed once at startup, in dependency order, and the only mutable global state is the recorder's atomic counters and the browser's context handles.
10. Where to read what
- Hang fix:
internal/render/browser.go— allocator, supervisor, recycle. Note theselect-with-time.Afterlaunch pattern (notWithTimeout) and theRWMutexaround parentCtx. - PDF mechanics:
internal/render/pdf.go— listener-then-load ordering, the four wait strategies, PrintToPDF option mapping. - Persistence:
internal/analytics/store.go— atomic write, corrupt-archive recovery, daily roll-up. - Redaction boundary:
internal/analytics/public.go— the only place that emits stats to the network. Never serialise*Recorderdirectly. - Middleware chain:
internal/httpx/server.go— chain assembly order is the spec contract. - v1 shim:
internal/handlers/legacy.go—Deprecation+Sunset+Linkheaders, warn log per call.
11. Open architectural questions
These are not blockers, but they're the places a future iteration would probably push:
- Per-tenant resource isolation. Today's rate limiter is per-key but the renderer pool is shared. A noisy tenant can hold semaphore slots for the full timeout, starving others. A weighted-fair-queueing scheme over the semaphore would fix this; v2 deliberately ships without it.
- Histogram precision. Fixed-bucket histograms give bounded memory and lock-free observations but coarse percentiles at the tail. A t-digest behind the same
Observe(int64)interface would swap cleanly when the dashboard view stops being sufficient. - Sidecar vs single-process. Today renderer + analytics + HTTP all live in one process. If render concurrency ever needs to scale past one host's CPU, splitting renderer into a sidecar pool would be cleaner than horizontal-scaling a stateful instance.
- Browser warm tabs. Currently every render creates a new tab. Pre-allocating a pool of warm tabs would cut the tab-creation overhead (~5-15ms) at the cost of more complex lifecycle management. Worth it only if p99 needs to drop below 100ms.